Measuring Diversity: A Quantitative Comparison Between India and the United States
What Is Diversity?
Diversity refers to the presence of differences within a given setting, encompassing variations in race, ethnicity, language, religion, gender, sexual orientation, and more. It plays a central role in shaping societies, influencing everything from cultural richness to policy frameworks. However, while the concept of diversity is often used qualitatively, it can also be rigorously quantified using statistical tools.
How Can Diversity Be Quantitatively Measured?
Quantifying diversity allows for objective comparison across regions, populations, or time. In the context of categorical data (e.g., religions, languages, ethnic groups), three commonly used metrics are:
- Simpson’s Diversity Index (D): Also known as the fractionalization index, it measures the probability that two randomly selected individuals from a population belong to different groups, D = 1 — ∑ pᵢ² where pᵢ is the proportion of group
- Shannon-Weiner Index (H): A measure derived from information theory, it reflects the uncertainty or entropy in the dataset, H = — ∑ pᵢ ln(pᵢ)
- Pielou’s Evenness Index (J): This indicates how evenly the individuals are distributed across different groups, J = H / ln(S)
Case Study 1: Religious Diversity
India (2011 Census)
- Hindu: 79.8%
- Muslim: 14.2%
- Christian: 2.3%
- Sikh: 1.7%
- Buddhist: 0.7%
- Jain: 0.4%
- Others/None: 0.9%
Calculated metrics:
- D = 0.3421
- H = 0.7130
- J = 0.3665
D=0.3421 means there’s about a 34.2% chance that two randomly selected individuals belong to different religions.
H=0.7130 quantifies the “information content” (higher → more diversity).
J=0.3665 (on a 0–1 scale) shows that the observed distribution is only about 36.7% as even as it would be if all seven groups were equally large.
United States (Pew 2014)
- Christian: 70.6%
- Unaffiliated: 22.8%
- Jewish: 1.9%
- Muslim: 0.9%
- Buddhist: 0.7%
- Hindu: 0.7%
- Other/Unknown: 2.4%
Calculated metrics:
- D = 0.4485
- H = 0.8595
- J = 0.4417
Conclusion:
— Higher D in the U.S. means there’s a greater probability (~44.9%) that two randomly selected Americans belong to different religious categories, versus ~34.2% in India.
— Higher H and J likewise indicate the U.S. has both a richer mix of groups and a more even spread across them.
In sum, by these common indices, the U.S. is measurably more religiously diverse than India (as of the most recent comparable data).
Case Study 2: Linguistic Diversity
India (2011 Census — 22 Scheduled Languages)
Proportions range from Hindi (43.63%) to Sanskrit (0.002%), including Bengali, Telugu, Marathi, Tamil, etc.
Calculated metrics:
- D = 0.7690
- H = 2.0730
- J = 0.6710
— We used the 2011 first‐language shares for the 22 schedule languages (e.g. Hindi 43.63%, Bengali 8.30%, …, Sanskrit 0.002%) and normalized them to sum to 1.
— The high D (≈ 0.77) and H (≈ 2.07) reflect both the large number of language groups and that none besides Hindi completely dominates.
— Evenness J≈0.67 shows the actual distribution is about 67% as even as it would be if all 22 languages were equally spoken.
United States (ACS 2011–5 Language Groups)
- English only: 78.5%
- Spanish: 13.4%
- Other Indo-European: 4.7%
- Asian & Pacific Islander: 3.6%
- Other: 1.8%
Calculated metrics:
- D = 0.3880
- H = 0.7990
- J = 0.4970
— We grouped home‐language use into five categories: “English only” 78.5%, “Spanish” 13.4%, “Other Indo-European” 4.7%, “Asian & Pacific Islander” 3.6%, and “All other languages” 1.8%, then normalized to sum 1
— Lower D (≈ 0.39) and H (≈ 0.80) are driven by the very large English share.
— Evenness J≈0.50 reflects that English heavily outweighs the other four groups.
India’s linguistic landscape is far more diverse and evenly distributed than that of the U.S.
Final Summary
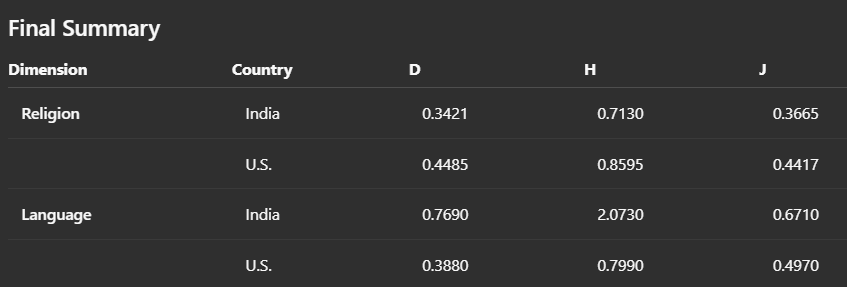
Conclusion
Quantitative analysis reveals that while India exhibits extremely high linguistic diversity, the United States is more diverse in terms of religion and ethnicity. These metrics provide a robust foundation for comparative sociocultural studies and policy design in multicultural contexts.
References
Religious Composition Data
India
- Source: Census of India 2011, Religion Data
- Link: https://censusindia.gov.in
United States
- Source: Pew Research Center, Religious Landscape Study (2014)
- Link: https://www.pewresearch.org/religion/religious-landscape-study/
Language Composition Data
India
- Source: Census of India 2011, Language Data — 22 Scheduled Languages
- Link: https://censusindia.gov.in/2011Census/C-16.html
United States
- Source: U.S. Census Bureau, American Community Survey (ACS) 2011 — Language Spoken at Home
- Link: https://data.census.gov